myCPP Tool User Guide
Welcome to the guide, we'll walk you through the steps to using the myCPP tool.
This guide includes:
Looking for how the EPA determined each state's goals? Click here for an explanation and example.
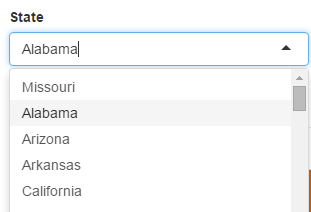
State Selection
The user selects which state to work with.
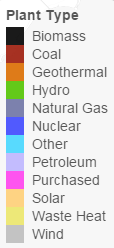
Map
All electricity generating units (EGUs) are shown and color-coded based on their technology.
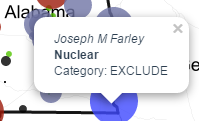
Some EGUs are excluded based on EPA guidelines. The user may click each EGU in order to view if they are excluded from the Clean Power Plan:
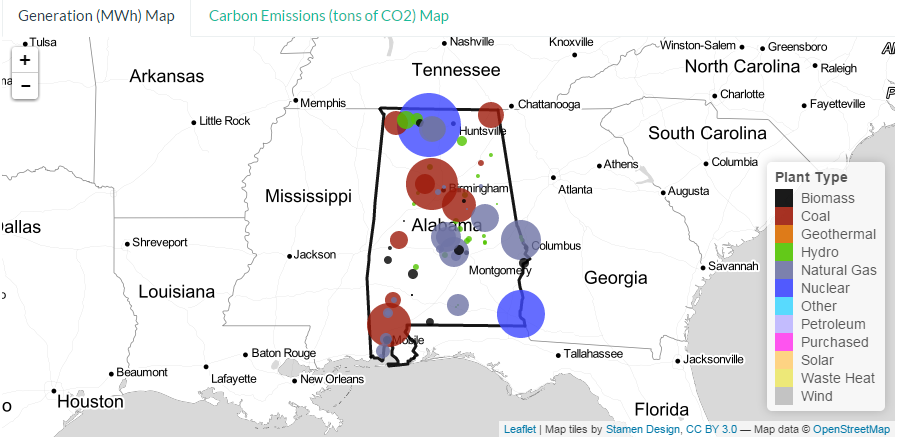
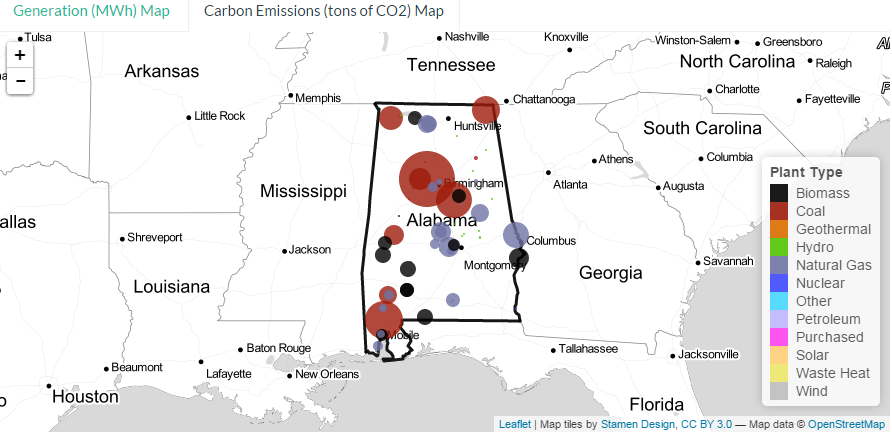
The user may select either Generation (MWh) Map or Carbon Emissions (tons of CO2) Map, which will proportionally adjust the color-coded region surrounding the EGU. This allows the user to gain an idea of each EGU’s energy generation and CO2 emissions.
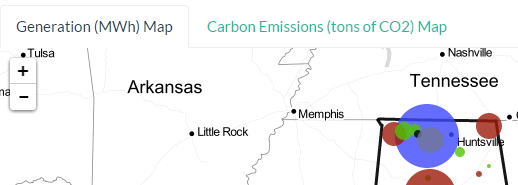
Generation (MWh) Map
Carbon Emissions (tons of CO2) map:
CO2 Emissions Graph
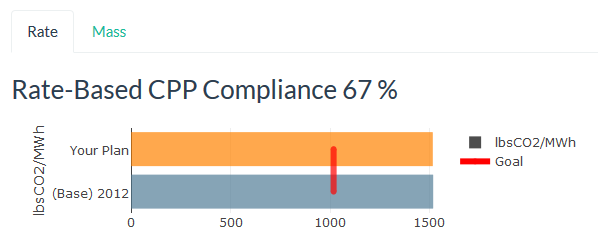
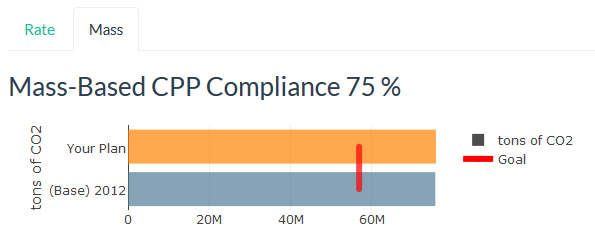
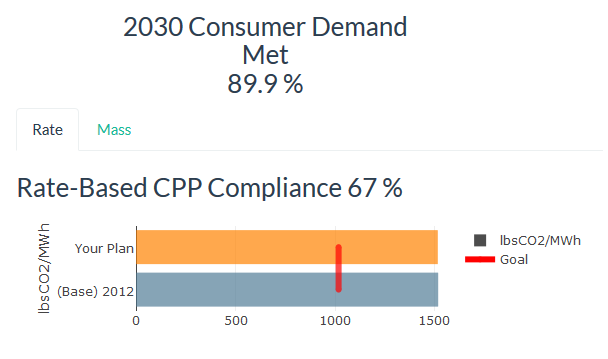
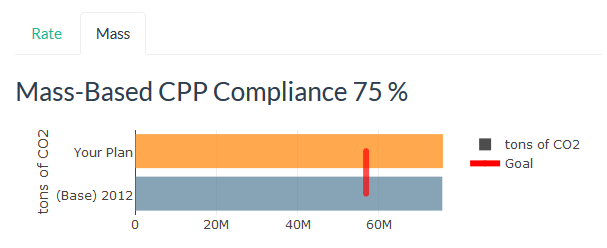
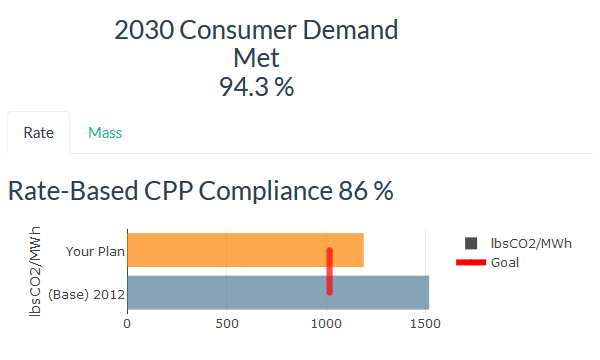
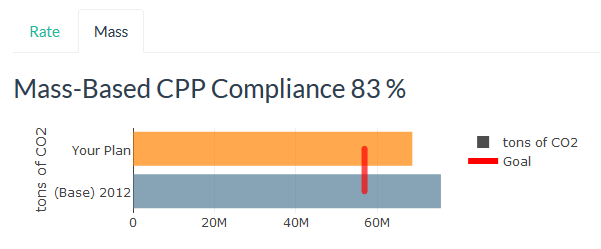
The selected state’s 2012 CO2 emissions total is shown in gray, and the potential CO2 emissions total based on adjusted sliders is shown in orange. The state’s goal per the CPP is indicated using a red line.
The user may switch between mass-based or rate-based calculations in order to view the differences in projected CO2 emissions, as well as the state’s rate-based mass-based compliance levels. These percentages change depending on the user’s adjustments to energy generation efficiencies and sources.
The rate-based CPP compliance calculations are based off of lbs CO2/MWh:
The mass-based CPP compliance calculations are based on tons of CO2 emitted:
Sliders:
Adjusting each energy generation source slider left or right changes three percentages: the percentage of the user’s state’s 2030 consumer demand met, the percentage of the selected state’s rate-based compliance to the EPA Clean Power Plan, and the percentage of the selected state’s mass-based compliance to the EPA Clean Power Plan. The goal is for all percentages to reach 100%.

Limits are set on each energy generation source in order to mimic the EPA’s future use and efficiencies projections based on past historical trends.
The user is able to achieve both goals by adjusting plant modifications, energy capacity additions and energy capacity reductions:
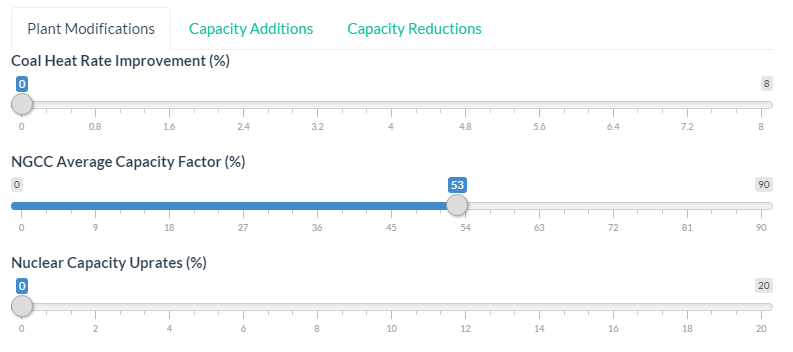
The Plant Modifications tab allows the user to adjust a state’s coal heat rate improvements, NGCC average capacity factor, and nuclear capacity uprates. These adjustments imply an increase in energy generation efficiency and a decrease in CO2 emissions.
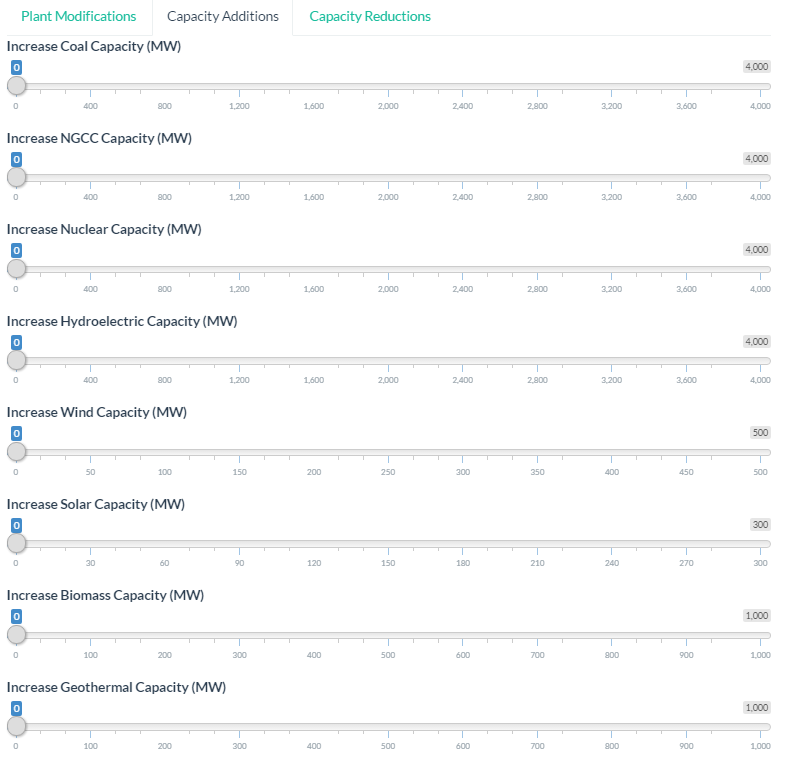
Capacity Additions allow the user to determine which energy sources may be added to boost the state’s CPP compliance and energy generation.
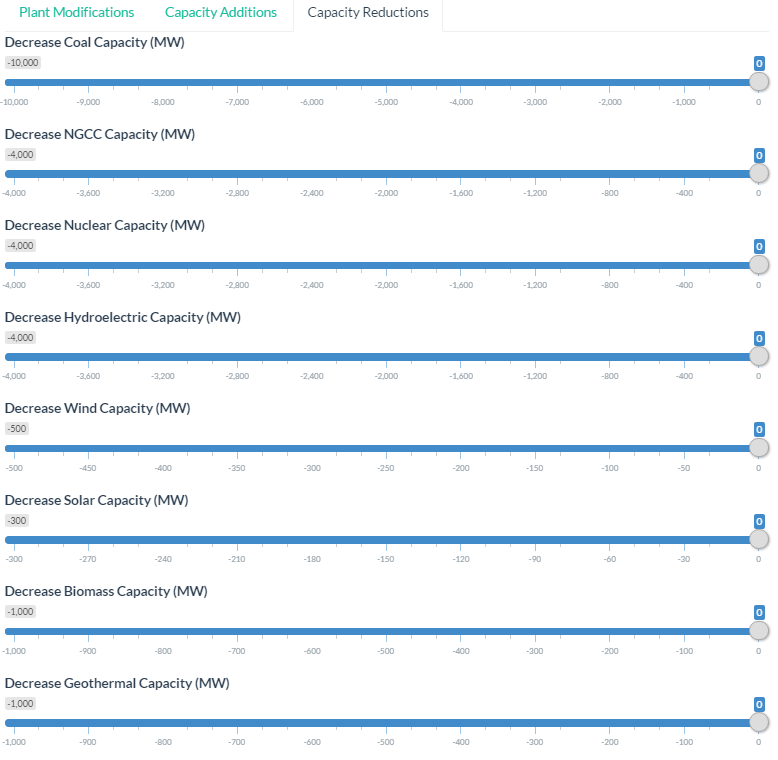
Capacity Reductions allow the user to determine which energy sources may be decreased or removed to boost the state’s CPP compliance and energy generation.
Walkthrough
Select your state.
Examine both tabs of the map to get a sense of what technology categories comprise the state generation and emissions.
Generation (MWh) Map:
Carbon Emissions (tons of CO2 ) Map:
Next, begin adjusting the sliders. You can watch the bar graphs update in real time as you adjust the energy efficiency and energy source sliders.
First, the Plant Modifications tab allows you to adjust your state’s coal heat rate improvements, NGCC average capacity factor, and nuclear capacity uprates.
Now take a look at which energy sources you can increase in your state’s Capacity Additions:
Finally, take a look at Capacity Reductions to decide what energy source(s) you might be able to decrease in order to meet your state’s goals.
Starting graphs:
With adjustments:
Note the combination of energy generation source changes that get your state closest to 100% achieved in both goals.